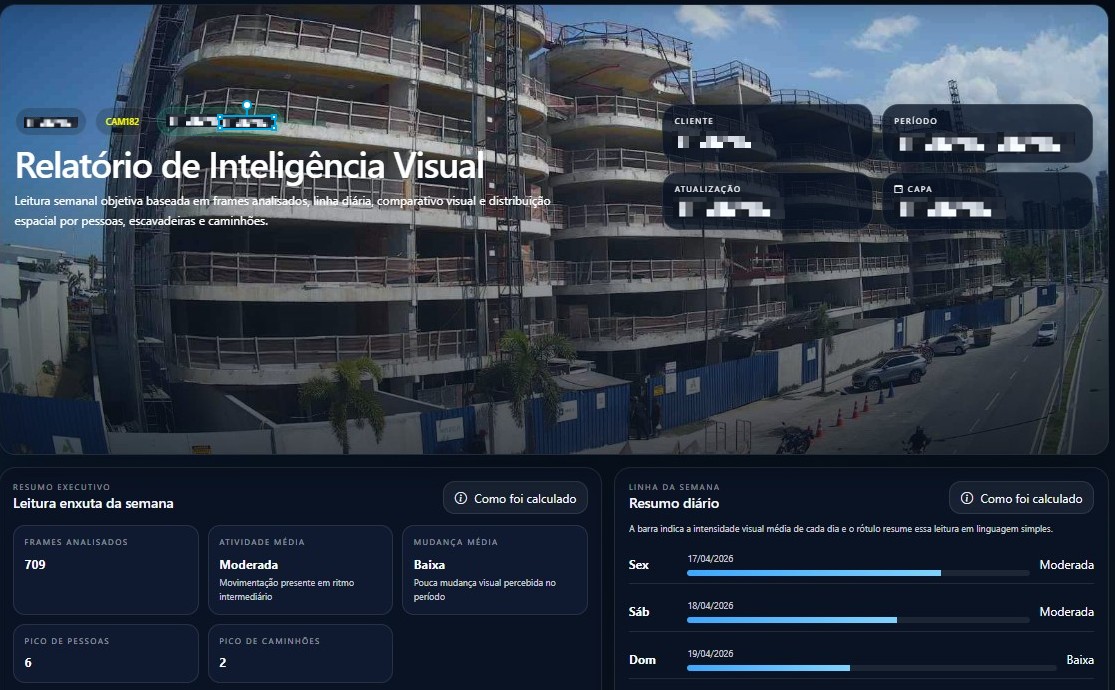
Automated Visual Intelligence reports generated by AI, with filters by people, excavators and trucks, and a spatial heat map identifying areas of highest activity.
Each report provides a weekly narrative reading of what happened on site, allowing managers and stakeholders to track project evolution objectively through visual data.
Everything you need to track your project's progress in a single weekly report.
Weekly narrative reading with the main events on site.
Automatically sent by email and WhatsApp to the entire team.
Spatial distribution of activity across the construction site.
Automatically filtered by people, excavators and trucks.
Side-by-side comparison of project progress week by week.
Record of all detections found during the week.
Daily and 30-day timelapses generated automatically.
Heat map segmented by people, trucks and excavators.
Slideshow of images marked as favorites during the week.
The complete report is delivered through the channels your team already uses.
Report automatically sent to the entire team's inbox.
Weekly snapshot delivered directly to the project group.
Access the complete interactive report on the NEXO platform.
Talk to our team and see how NEXO can transform your project's visual management.
No commitment. Our team will respond within 24 hours.
Thank you! Our team will get back to you shortly.